
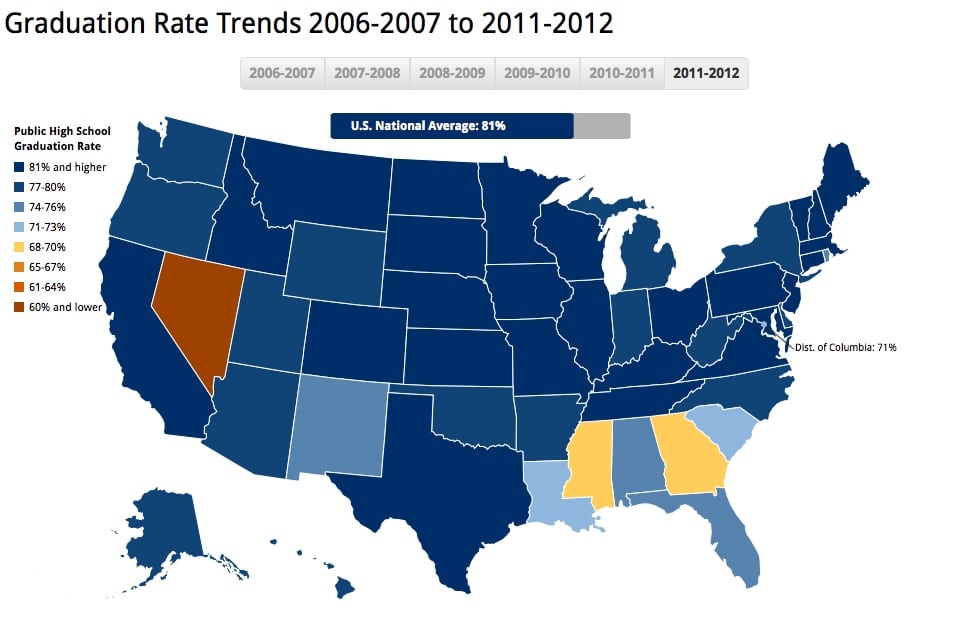
The color-coded maps below show graduation rates in 2007 (top) and 2012 (bottom) with higher graduation rates in blue and lower graduation rates in orange or yellow. Georgia’s graduation rate increased six points during this time period, from 64 percent to 70 percent, but still continues to lag behind all but two states. Source: Education Week


The color-coded maps below show graduation rates in 2007 (top) and 2012 (bottom) with higher graduation rates in blue and lower graduation rates in orange or yellow. Georgia’s graduation rate increased six points during this time period, from 64 percent to 70 percent, but still continues to lag behind all but two states. Source: Education Week
More Commentary
Atlanta’s Infrastructure in the Global Spotlight
The Hidden Price of Social Security
The Reporting Gap in School Choice