
Background: A 40-Year-Old Funding Formula
Georgia’s education system has used the same funding formula for 40 years. The Quality Basic Education Act, or QBE as it’s commonly known, was enacted in 1985 to fairly distribute funding to Georgia public schools and has been in use since the 1986-87 school year. Additionally, QBE was intended to bridge gaps in public school funding across the state to improve students’ education. To address unequal funding, largely caused by differences in local contributions, QBE uses the number of full-time equivalent students (FTE), categories of instructional programs, teacher experience, and local property wealth to adjust district and school funding based on the perceived needs these categories indicate. Although QBE adjusts for local property wealth in the aggregate, it fails to appropriately adjust for individual student poverty levels. Consequently, QBE, as currently designed, contributes to keeping some areas continually poverty-ridden—the modern-day tale of two cities where some areas have high socio-economic status and others do not. Because poverty-stricken areas face many more educational challenges, it seems appropriate for QBE to correct for these budgetary shortcomings; that is, we would expect per-pupil expenditures to be higher in high poverty areas compared to low poverty areas. Unfortunately, the data tell a different story.
How QBE Allocates Funding
QBE uses 18 instructional categories to determine the amount of funding schools will receive, along with indirect earnings for system-based factors such as central office staff and media centers, and three staff-based factors (training, experience and health insurance eligibility). Each instructional category is given a specific weight to adjust for the varying costs of delivering different types of programs. For example, districts and/or schools with more students taking special education or English as a second language (ESL) classes receive more funding than districts and schools with fewer students enrolled in those programs. In fiscal year 2022, the formula called for funding of just over $6,700 for each student categorized as a type 1 special education student, compared to over $16,000 for every FTE student categorized as type 4 special education. QBE effectively ensures more funding is given to the students who need more instructional help. However, QBE only concentrates on grade levels and instructional categories; it does not directly address other student characteristics such as poverty, which may have profound effects on student achievement and long-term student outcomes. In this sense, Georgia directly funds programs as an indirect way of addressing student needs—whereas most other states, from Tennessee and Texas to California and New York, directly fund student characteristics as an indirect way of addressing the cost of delivering programs for them. This subtle difference may lead to significantly different outcomes than the authors of QBE intended.
Local Wealth, the 5-Mill Share, and Uneven Outcomes
Furthermore, one would hope that overall, per-pupil expenditures in low-income and low-wealth areas would be higher to address the inequity issues associated with poverty-stricken areas. Low-wealth areas may suffer from a depressed tax base, which means fewer funding opportunities from local property taxes; currently an average of about 45 percent of district funding comes from local revenues and about 46 percent comes from the state, with the balance coming from federal funds. Approximately 74 percent of Georgia districts receive more funding from the state than they do from local revenue.
QBE does account for local property wealth by subtracting funding equivalent to a 5-mill tax on the local district’s property tax base, known as the “5 mill share.” As an illustration of how this affects two otherwise comparable districts, in 2024 Atlanta Public Schools (48,873 students, 76 percent of them economically disadvantaged and 13.3 percent with disabilities) earned total state funding of $8,155 per pupil via QBE. Just to the south, Clayton County School District (51,148 students, 99.7 percent of them economically disadvantaged and 11.8 percent of them with disabilities) earned slightly more at $8,478 per pupil. However, the greater property wealth in Atlanta was reflected in the 5-mill share, as the state deemed Atlanta able to raise four times as much as Clayton County from a 5-mill tax on its property owners. As a result, the state paid Atlanta only $4,098 per student compared to $7,554 for Clayton County.
Data on Poverty and Per-Pupil Spending Show No Correlation
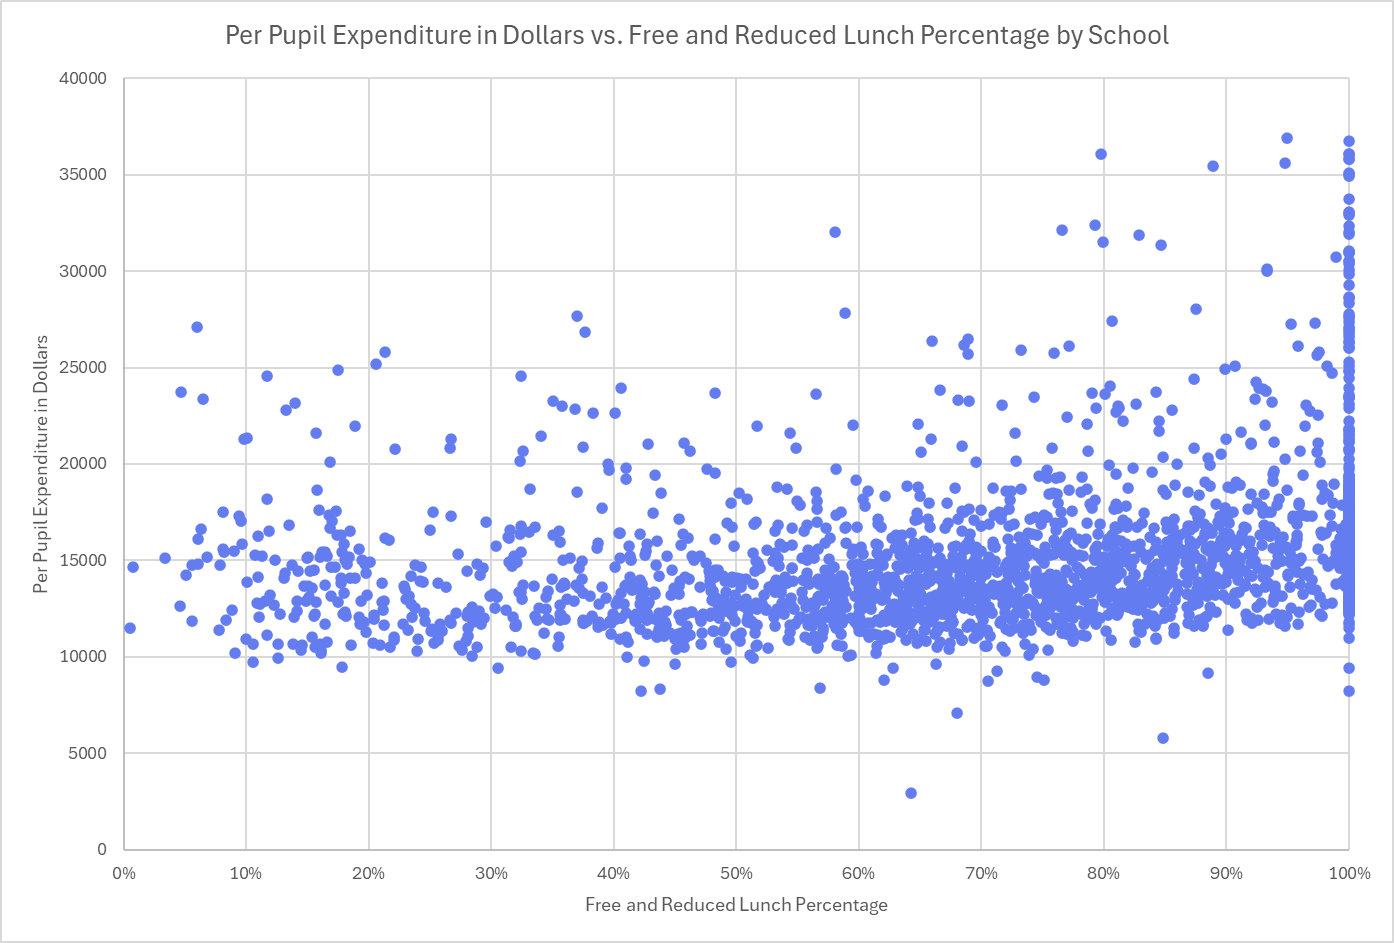
Yet, the data suggest that overall K-12 per-pupil spending among districts and schools is not tied to relative poverty levels. The Georgia Department of Education reports data on students qualifying for free and reduced-price lunch, which has traditionally been used as a proxy for relative income levels in the community. Using these data along with the total per-pupil expenditures per school, anomalies appeared. For example, just 3.4 percent of students in Birmingham Falls Elementary School in Milton, a wealthy suburb in north Fulton County, are on the free and reduced-price lunch program, and the school has a total per-pupil expenditure (federal, state and local) of $15,096. Meanwhile, Chatsworth Elementary School in rural Murray County has 84 percent of its enrollment on the lunch program with a total per-pupil expenditure of $11,720. This phenomenon is more ubiquitous than one might imagine. The average FRL percentage of Ashford Park Elementary, Autrey Mill Middle, Big Creek Elementary, Virginia-Highland Elementary and Westchester Elementary was 12.8 percent, while the average per-pupil expenditure of those five schools was $19,032. The average FRL for Cass Middle, Eastside Elementary, Lewis Frasier Middle, Waynesville Primary, and Westside Elementary was 67.8 percent with a per-pupil expenditure of $12,032. When looking at the data in the aggregate, there is virtually no correlation (r = .08) between the percentage of students in the free and reduced-price lunch program and total per-pupil expenditures. The following graph illustrates the lack of correlation between income and per-pupil expenditures.
The Bigger Problem: Persistent Concentrated Poverty
Unfortunately, the upshot of this situation is the persistence of concentrated areas with high levels of poverty. QBE was designed to correct for funding disparities between schools in different districts in Georgia, and it does successfully fund districts and schools based on student enrollment in various educational programs. However, to the extent this 40-year-old funding formula was intended to address the concerning inequities of income/wealth distributions by giving students from poorer families and neighborhoods a greater opportunity to improve their lot in life through education, it must be deemed a failure: poor areas remain poor, and wealthy areas remain rich. The persistence of this division between the haves and the have-nots is likely perpetuated by the fact that QBE’s formula largely ignores the role poverty may play in schooling outcomes. The solution, though, may not be in simply adjusting the formula; maybe it is time to rethink the system to address this central issue more head-on as so many other states do.
Shifting the Question: What Should the State Fund?
Indeed, these findings may lead us to a more robust and fundamental question regarding K-12 schooling policy: Who or what should the state fund? The state could choose to fund the system based on programs, or it could choose to fund the student based on the student’s characteristics. Employing the latter would not only lead to fairer funding outcomes among school districts; it could also empower students and their families to make educational choices that best fit their needs. In addition, the proverbial tale of two cities scenario of concentrated poor and wealthy areas may indeed be addressed if we were to fund the students (demanders) rather than districts and schools (suppliers). A universal student-centered funding program may result in the tearing down of the invisible walls (known as school districts) that divide us by income and wealth, because wealthier families will no longer need to flee poorer areas to seek better schools. Funding students allows those students a true opportunity likely to result in a more economically integrated society.
Conclusion: Time to Revisit QBE and Consider Systemic Reform
Low-income issues in K-12 funding are often addressed at the federal level through Title I funding; however, it may be time for Georgia to revisit its funding formula and school system administration at large to address the concentration of poverty issue ubiquitous in the United States. The QBE lacks a poverty adjustment; a change there may indeed allow low-wealth areas to better fund their schools; however, a system change that funds students instead of schools may be a key link in the wealth division prevalent in the U.S. It may be a warranted time to review both the specifics of the QBE funding formula and who/what that formula funds.