
In each test and at each grade level, Georgia’s students have significantly improved their ranking compared to other states.


By Kelly McCutchen
Where does Georgia rank in education? Most people look at graduation rates and SAT scores and answer: “Near the bottom.”
But states have different graduation requirements and not everyone takes the SAT.
The National Assessment of Educational Progress (NAEP) provides a better comparison.
A fair analysis also has to address varying poverty rates. No matter how you look at test scores – by state, by system or by school – there is a strong negative correlation between test scores and poverty. In other words, the higher the poverty rate, the lower the test scores.
Georgia has one of the top 10 highest K-12 poverty rates in the nation, so the best way to compare states is to compare poor students in Georgia with poor students in other states, and vice versa.
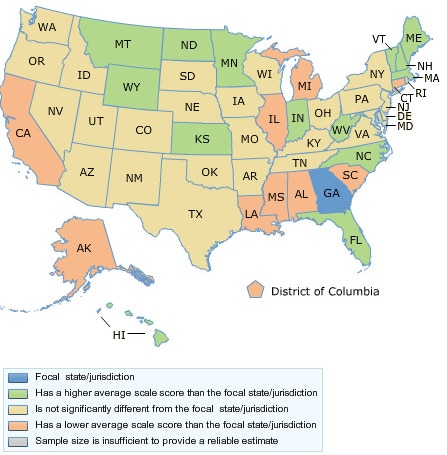
The nearby charts show how Georgia compares to other states in the NAEP 4th Grade Reading and 4th Grade Math tests after breaking out poor and non-poor students. Georgia performs as well or better than all but the states in green.
In reading, only Massachusetts and the District of Columbia outperform Georgia in terms of non-poor students. For poor students, six states outperform Georgia, including our neighbor to the south, Florida.
In math, our non-poor 4th graders are only outperformed by four states, but our poor students are outperformed by 14 states, including our neighbors, Florida and North Carolina.
So in summary, except for low-income students in math, Georgia’s 4th graders consistently outperform about a third to a half of the states, and only a handful of states can say they are performing statistically better than Georgia.
The results for 8th grade are similar for reading, where only six states outperform Georgia’s non-poor students and only eight states outperform Georgia’s low-income students. In math, only 10 states outperform Georgia’s non-poor students, but 23 states outperform Georgia’s low-income students, including North Carolina, Florida and Texas.


Going back a decade shows Georgia’s tremendous progress over time. The charts below compares the ranking of Georgia’s average scaled score on the NAEP tests in 2003 and 2013. The state rankings are located along the bottom of the chart, with 1 being the best. Georgia’s rank is indicated with black squares and the arrows highlight the improvement from 2003 to 2013.


In each test and at each grade level, Georgia’s poor and non-poor students have significantly improved their ranking compared to other states.
The next logical question is to examine similar states that are outperforming Georgia. In the list below are states that 1) have poverty rates above the national average and 2) have statistically outperformed Georgia (states shown in green on the maps).
This gives us six states: Delaware, Florida, North Carolina, Oregon, Texas and Utah.
The interactive chart below compares NAEP performance with spending levels. (You can toggle between the different tests and filter by poverty rate using the controls on the right side of the chart.)
The spending per pupil (adjusted for cost of living differences) for these states are:
- Georgia $9,890
- Delaware $13,522
- Florida $8,535
- North Carolina $9,160
- Oregon $9,659
- Texas $8,600
- Utah $6,772
Other than Delaware, these states have three things in common: 1) They have similar poverty rates to Georgia (all are above the national average), 2) they are spending less money per student than Georgia (adjusted for cost of living) and 3) they have significantly outperformed Georgia students in at least one area.
For comparison, Georgia has more than 1.6 million students, so every dollar change in per student spending is equivalent to more than $1.6 million dollars.
This is, of course, only one way to analyze the data. That is why we have made these interactive charts available to the public for anyone to create their own state comparison based on the underlying testing, demographic and financial data. We look forward to your comments and analysis.
[November, 2015 update: A new study has found similar results. The study by the Urban Institute adjusted state NAEP scores based on factors such as race, ethnicity, the share of students still learning English and poverty, as reported by Libby Nelson in Vox. Georgia makes the top 20 in adjusted student achievement and makes the top ten in adjusted academic growth from 2003-2013. Southern states like Texas (#3), Florida (#4) and North Carolina (#7) outperform Georgia while spending less per student. It’s also interesting that the top 10 increase in scores occurred during the period of the much discussed “austerity cuts.”]
NAEP 4th Grade Reading – Eligible For F/R Lunch
NAEP 4th Grade Reading – Not Eligible For F/R Lunch
NAEP 4th Grade Math – Eligible For F/R Lunch
NAEP 4th Grade Math – Not Eligible For F/R Lunch
By Kelly McCutchen
Where does Georgia rank in education? Most people look at graduation rates and SAT scores and answer: “Near the bottom.”
But states have different graduation requirements and not everyone takes the SAT.
The National Assessment of Educational Progress (NAEP) provides a better comparison.
A fair analysis also has to address varying poverty rates. No matter how you look at test scores – by state, by system or by school – there is a strong negative correlation between test scores and poverty. In other words, the higher the poverty rate, the lower the test scores.
Georgia has one of the top 10 highest K-12 poverty rates in the nation, so the best way to compare states is to compare poor students in Georgia with poor students in other states, and vice versa.
The nearby charts show how Georgia compares to other states in the NAEP 4th Grade Reading and 4th Grade Math tests after breaking out poor and non-poor students. Georgia performs as well or better than all but the states in green.
In reading, only Massachusetts and the District of Columbia outperform Georgia in terms of non-poor students. For poor students, six states outperform Georgia, including our neighbor to the south, Florida.
In math, our non-poor 4th graders are only outperformed by four states, but our poor students are outperformed by 14 states, including our neighbors, Florida and North Carolina.
So in summary, except for low-income students in math, Georgia’s 4th graders consistently outperform about a third to a half of the states, and only a handful of states can say they are performing statistically better than Georgia.
The results for 8th grade are similar for reading, where only six states outperform Georgia’s non-poor students and only eight states outperform Georgia’s low-income students. In math, only 10 states outperform Georgia’s non-poor students, but 23 states outperform Georgia’s low-income students, including North Carolina, Florida and Texas.
NAEP 8th Grade Reading – Eligible For F/R Lunch
NAEP 8th Grade Reading – Not Eligible For F/R Lunch
NAEP 8th Grade Math – Eligible For F/R Lunch
NAEP 8th Grade Math – Not Eligible For F/R Lunch
Going back a decade shows Georgia’s tremendous progress over time. The charts below compares the ranking of Georgia’s average scaled score on the NAEP tests in 2003 and 2013. The state rankings are located along the bottom of the chart, with 1 being the best. Georgia’s rank is indicated with black squares and the arrows highlight the improvement from 2003 to 2013.
In each test and at each grade level, Georgia’s poor and non-poor students have significantly improved their ranking compared to other states.
The next logical question is to examine similar states that are outperforming Georgia. In the list below are states that 1) have poverty rates above the national average and 2) have statistically outperformed Georgia (states shown in green on the maps).
This gives us six states: Delaware, Florida, North Carolina, Oregon, Texas and Utah.
The interactive chart below compares NAEP performance with spending levels. (You can toggle between the different tests and filter by poverty rate using the controls on the right side of the chart.)
The spending per pupil (adjusted for cost of living differences) for these states are:
- Georgia $9,890
- Delaware $13,522
- Florida $8,535
- North Carolina $9,160
- Oregon $9,659
- Texas $8,600
- Utah $6,772
Other than Delaware, these states have three things in common: 1) They have similar poverty rates to Georgia (all are above the national average), 2) they are spending less money per student than Georgia (adjusted for cost of living) and 3) they have significantly outperformed Georgia students in at least one area.
For comparison, Georgia has more than 1.6 million students, so every dollar change in per student spending is equivalent to more than $1.6 million dollars.
This is, of course, only one way to analyze the data. That is why we have made these interactive charts available to the public for anyone to create their own state comparison based on the underlying testing, demographic and financial data. We look forward to your comments and analysis.
[November, 2015 update: A new study has found similar results. The study by the Urban Institute adjusted state NAEP scores based on factors such as race, ethnicity, the share of students still learning English and poverty, as reported by Libby Nelson in Vox. Georgia makes the top 20 in adjusted student achievement and makes the top ten in adjusted academic growth from 2003-2013. Southern states like Texas (#3), Florida (#4) and North Carolina (#7) outperform Georgia while spending less per student. It’s also interesting that the top 10 increase in scores occurred during the period of the much discussed “austerity cuts.”]
Kelly McCutchen is President and CEO of the Georgia Public Policy Foundation.
More Commentary
New Laws Ease Georgia’s Occupational Licensing Burden
Congress Passed a Bipartisan Housing Bill, but Homeownership Challenges Remain
Are Georgia’s Tort Reforms Starting to Pay Off?