

Last week’s release of 8th grade US history and civics tests delivered another round of bad news for students and schools. The top line results from the National Assessment of Educational Progress (NAEP) showed the first declines ever recorded in civics scores, and even larger drops in US history scores.
Though not totally surprising on the heels of the pandemic, the disappointing results raised concerns across the board about the amount and quality of civics and history instruction students are getting. Certainly, there are legitimate concerns here, and inevitably there will be unserious ones, but one that likely won’t get its due is the uneven distribution of changing scores over time. Two graphs that depict test results over time starkly illustrate why we should be concerned with that pattern, especially since it is not limited to history or civics.
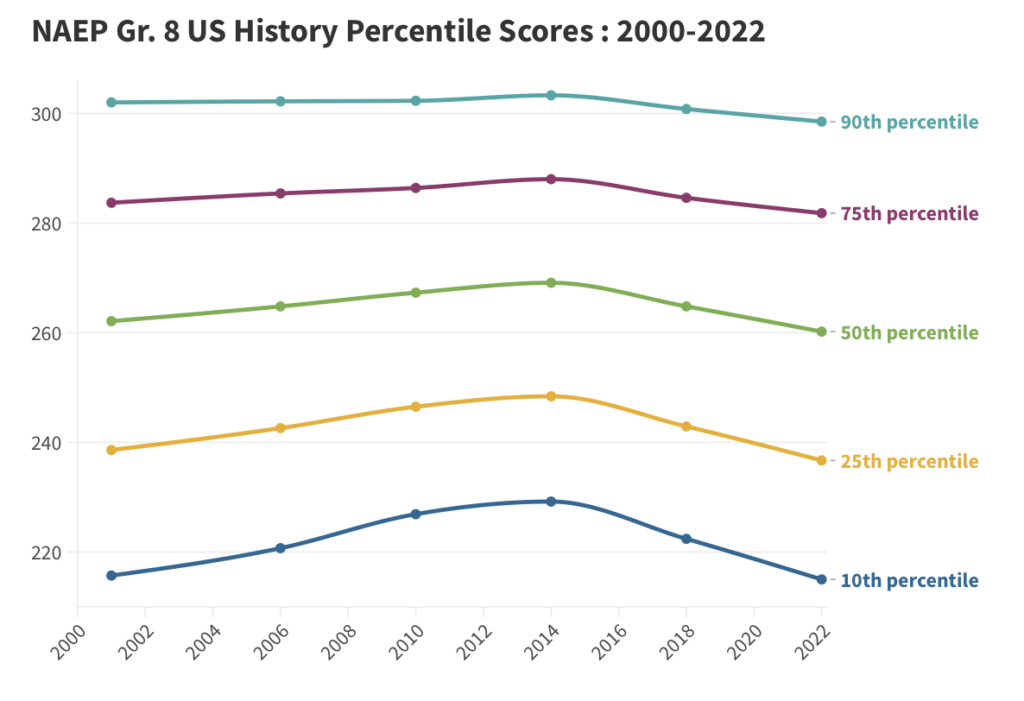
The first figure below shows changes in 8th grade US history NAEP scores over two decades for students scoring from the 10th through 90th percentiles. Across the board, the high water mark is in 2014 with declines in 2018 and 2022. Not all of apparent changes are statistically significant, but the action is clearer at the low end. Students at the 10th and 25th percentiles saw more growth before 2014 and greater losses afterward. These differences look relatively small because the scale of the graph, at 90 points, makes the differences between the highest and lowest scores stand out more than the differences within those groups.
Change the scale and the size of those within group differences become clearer. The second figure plots the same data, but subtracts the 2014 score (which were the highest across the board) for each percentile from the percentile score in the other years. By subtracting the 2014 score for each group, the graph’s scale shrinks markedly, from 90 to 15 points, and 2014 scores all become zero. This also makes the relative test score changes for different percentiles before and after 2014 come into sharp relief.
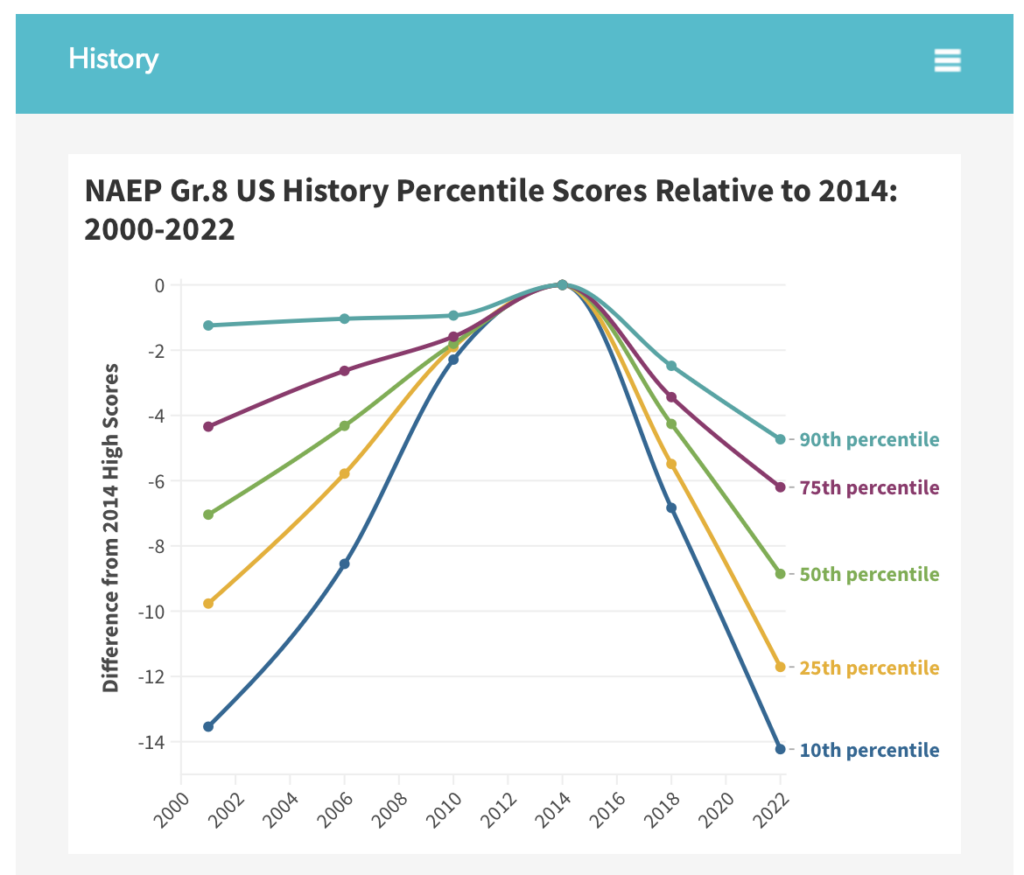
Leading up to 2014, the lowest-scoring students had greater gains in the first 13 years than the highest scorers. In the past eight years, they also had the largest declines. Declines at the 25th percentile were double those at the 75th, and those at the 10th percentile were triple those at the 90th percentile. The shift in scores at the 10th percentile is startlingly huge, almost half a standard deviation between 2014 and 2022.
Similar, if somewhat less clean, patterns are evident not only in civics, but also reading and math. The recent NAEP score drop focuses on history and civics, but we should keep in mind that the challenges our lowest performers face extend well beyond those subjects. US history and civics are important subjects for students to know heading into high school and it is disheartening to see students’ grasp of them fall precipitously. What’s even more concerning, though, is the yawning chasm between students at the lowest end of the distribution and those at the top end. That chasm is particularly troubling because it is evident in other subjects, as well.
The latest rounds of NAEP scores are variations on a theme: students are academically worse off now than any time in the past 20 years. Lying beneath those troubling averages is the fact that the floor is dropping faster for our lowest achieving students. There is plenty or reason for concern about specific subjects (for some incisive commentary on this, read this piece by my colleague, Rick Hess), but the big picture problem is not confined to any single subject.
We miss that larger pattern at our peril.

More Commentary
Milton Friedman Was Right About School Choice
New Laws Ease Georgia’s Occupational Licensing Burden
Congress Passed a Bipartisan Housing Bill, but Homeownership Challenges Remain