
A data-driven analysis of investor ownership, housing supply constraints and mortgage access in metro Atlanta.
Executive Summary
While the presence of corporate ownership in the single-family housing market is increasingly central in the affordability debate, the data regarding their direct impact on rising home prices are disputable. Popular discussion of institutional investors features inconsistent definitions and benchmarks, which complicates analysis of their market impact. Narratives on this topic are also confusing and undefined. Specific examples include conflating the percentage of corporate investor-owned single-family rentals with the total percentage of single-family rental homes, while the specifications of what exactly constitutes an institutional investor remain undefined and lead to analytical inconsistencies.
Institutional investors have faced increased scrutiny from policymakers in recent years, with both federal and state lawmakers attempting to restrict their activities. With this heightened focus on their behavior in metro Atlanta, the Georgia Public Policy Foundation sought to examine and bring clarity to this issue. Our review found the following:
- Despite ambiguity in how exactly institutional investors are defined, it is reasonable to conclude that metro Atlanta has the highest concentration of institutional investor owned housing of any metropolitan area in the United States.
- The number of investor-owned homes in metro Atlanta peaked from 2014-2017, as the housing market recovered from the Great Recession and the subsequent decline of Georgia’s homebuilding and community banking industries. In all 12 of the metro Atlanta counties that were analyzed, the owner-occupancy rate has increased since 2017.
- While the presence of investors has correlated with short-time price movements, such movements are usually driven by broader housing market dynamics. One of these dynamics is the artificial suppression of new housing stock through excessive regulation, which prevents industry from responding to higher prices and unmet demand by creating more supply.
- The increased presence of investor-owned housing in metro Atlanta had a limited measurable impact on home prices in the period from 2000 to 2024. While this period does include the stabilization of cratering home prices in the wake of the Great Recession, the highest recorded concentration of investor-owned housing did not correlate with home prices above historical benchmarks.
Lastly, analysis of financing and lending on housing affordability in recent years has primarily focused on the Federal Reserve’s decision to raise interest rates from March 2022-July 2023. Less attention has been paid to the impact of lending reforms in the Dodd-Frank Act of 2010 on potential borrowers, in which Qualified Mortgage standards have effectively locked out a majority of Americans from being able to secure the necessary financing to purchase a home.
Roughly 65 percent of mortgages that originate in the United States now belong to borrowers with superprime (considered 760 and above) credit scores. This is particularly detrimental for younger borrowers, who often lack the credit score needed to qualify for a mortgage.
Introduction
As many Americans feel the effects of rising housing prices, lawmakers are beginning to take notice and offer solutions. One popular topic over the past few years has been the buying of properties by “institutional investors.” This term is usually a catch-all for private equity firms, real estate investment trusts, hedge funds and other large corporations that make bulk purchases of homes and properties with the intention to rent them.
A common claim made by frustrated constituents and lawmakers–and a common motivation for legislation that targets investor activity–is that large, out-of-state corporations are buying up too many properties. In turn, critics say, this activity limits access to housing which is affordable as investors outbid consumers for homes on the market or raise rental costs to an extent that disadvantages tenants with unfair practices. This claim seems to have bipartisan appeal, but investors’ real impact on the housing market is debatable and merits further examination. This report will examine the data and assess the prevalence of institutional investors in the metro Atlanta market, as well as the shift in federal regulations in the wake of the Great Recession that led to an increase in single-family rentals.
Institutional investors and public policy
During the 2025 legislative session, Georgia lawmakers in both parties sought to limit investor ownership in the state.
The “Georgians First Residential Property Protection Act” (House Bill 555), introduced by Rep. Derrick McCollum (R‑Chestnut Mountain), would prohibit corporate entities from owning an interest in more than 2,000 single-family residential properties or 10 multifamily residential properties. It would also enforce sales penalties if those limits were exceeded.
The “Protect the Dream Act” (House Bill 305), introduced by Rep. Phil Olaleye (D‑Atlanta), would limit investment funds that owned over $6.25 million in assets or 25 single-family homes in one county from buying additional property in Georgia. The bill’s author blamed such institutions for higher costs of living and the crowding out of vulnerable communities.
Beyond directly limiting their economic activity, lawmakers also introduced bills to more closely regulate institutional investors. Notably, the only bill on this topic to become law was House Bill 399, introduced by Rep. Mary Oliver (D‑Decatur), which required out‑of‑state landlords to employ a local broker or property manager to handle tenant issues. House Bill 374, introduced by Rep. Martin Momtahan (R‑Dallas), would have created a public registry logging corporate landlords who own at least 10 contiguous rental units.
Institutional investors in Georgia have also earned the attention of lawmakers at the federal level, including both of Georgia’s U.S. senators. Sen. Jon Ossoff launched an investigation of several large, out-of-state investors, which he claims “are buying up homes and pushing Georgia homebuyers out of the market.” Sen. Raphael Warnock’s “Stop Predatory Investing Act” would prohibit investors with 50 or more single-family rentals from claiming tax deductions for interest or depreciation on those properties. It also includes tax incentives for investors who sell their units to individual homebuyers or nonprofits.
The government’s response to the presence of these investors in the decade and a half since the global financial crisis remains haphazard. In 2017, Fannie Mae backed a 10-year, $1 billion loan to Invitation Homes, one of the largest investors in single-family rental housing, while Freddie Mac launched a pilot program designed to provide liquidity and stability for mid-sized investors and uniform credit standards on loans for single-family rental properties. Ultimately, the Federal Housing Finance Agency directed both agencies to end these programs in 2018 after concluding that large investors did not require such support.
While HB 399 was the only of the aforementioned state bills to make it out of the House, and the Stop Predatory Investing Act has not advanced beyond the U.S. Senate Finance Committee, institutional investors are increasingly central to the housing policy debate in Georgia and beyond.
Defining institutional investors
Efforts to measure the impacts of institutional investors are frequently complicated by inconsistencies in defining them. Most of the public policy conversation around institutional investors is, in practice, focused on activity in the single-family rental (SFR) market. In addition to different quantitative benchmarks, public discourse often employs a wide and inconsistent set of labels to describe institutional activity in the SFR space.
Terms like “institutional investors,” “out-of-state homebuyers,” “corporate landlords,” “hedge funds,” “private equity” and “real estate investment trusts” are used almost interchangeably in this context. But these labels are not synonymous, and many refer to different types of entities, investment vehicles and stages of involvement in the housing market. For example, a publicly traded investment trust that acquires and manages thousands of homes operates differently from a private equity fund that capitalizes a third-party operator, yet both are frequently grouped under the same umbrella in public debate. This lack of precision further complicates assessing the scale and nature of institutional participation and comparisons of findings across studies. (It is also worth noting that virtually every rental home–i.e., any home not occupied by its owner–is by definition “investor owned.” Because the validity of rental properties generally is not in question, the issue essentially comes down to whether the distinction between “investor owned” and “institutional investor owned” even matters in the marketplace.)
In a 2025 report, “Housing Affordability and the Role of Institutional Investors,” the Texas Conservative Coalition Research Institute (TCCRI) compiled a few varying definitions:
- A 2018 study of Atlanta by the Department of Housing and Urban Development (HUD) defined “large corporate landlords” as owning more than 15 single-family rental properties. For comparison, Harvard’s Joint Center for Housing Studies considers investors with at least 100 properties to be “large,” and an Urban Land Institute report defines “institutional” investors as those that own at least 2,000 homes.
- Freddie Mac defines small investors as owning one to nine properties, medium investors as owning 10 to 99 properties and institutional investors as owning more than 100.
- HUD’s Office of Policy Development and Research established definitions as small (one to nine units), medium (10 to 99 units), large (100 to 999) and institutional (more than 1,000) investors based on the number of units in their respective portfolios.
Thus, while it is common to see investors categorized based on the number of properties or units owned, there is little consensus as to what those benchmarks should be. In a more qualitative definition, the Financial Industry Regulatory Authority defines institutional investors as “professional investors who pool together capital…and invest on behalf of others, typically at much higher volumes than retail investors.”
The lack of a consensus definition is just one factor that makes it difficult to collect a conclusive body of research on the effects of institutional investment on the housing market. In the context of nationwide housing shortages, the measurable impact of institutional investors is mixed.
These discrepancies are important to point out when referencing cities with relatively high market shares of institutional investors. Atlanta is frequently cited as the metro area with the largest amount of investor activity in the country. The data also reflect this when reviewing metro Atlanta’s institutional investor-owned housing stock compared to other large metropolitan areas across the United States. However, reporting on ownership rates in metro Atlanta’s single-family housing market varies depending on how “institutional investor” is defined and what is being measured. For example, a recent analysis by the American Enterprise Institute estimated institutional investors’ presence at 4.2 percent across the metro area. That report defined institutional ownership as entities holding 100 or more homes and measured ownership as a share of the overall housing stock. Taking a different approach to the subject, the Atlanta Journal-Constitution has noted that investors control roughly 30 percent of metro Atlanta’s single-family rental stock. The AJC’s accounting of investor presence used different parameters for what counts as an institutional investor and a much smaller pool of homes (single-family rentals as opposed to total housing stock, which AEI measured). Such a wide contrast in framing the issue highlights how different methodologies, definitions and scopes of study can produce different impressions of the scale of investor activity.
By most definitions, however, investor presence tends to be most consistently high in the Sunbelt. Cities like Atlanta, Charlotte, Jacksonville, Dallas and Houston consistently receive attention from policymakers and the media for their relatively high share. For example, the AEI report notes that Invitation Homes, which holds a portfolio of over 85,000 homes for lease, operates “in markets with strong demand drivers, high barriers to entry and high rent growth potential, primarily in the Western United States, Florida and the Southeast United States,” per the company’s 10-K report.
This geographic concentration reflects broader demographic and economic trends. The Sunbelt has experienced rapid population growth over the past few decades, driven by a combination of domestic migration, job growth, relatively affordable housing (at least historically) and a temperate climate. Many households relocating from higher-cost regions are seeking single-family homes in growing metros where new construction has not fully kept pace with demand. This influx, combined with the regulatory environment, puts pressure on both for-sale and rental markets, creating conditions like those referenced by Invitation Homes in its annual financial report.
Investors and housing prices
In the years following the Great Recession, investors (of all sizes) acquired a significant number of single-family homes, often through bulk purchases of foreclosed properties. This dynamic was even facilitated by the federal government, with financial backing offered by the Federal Housing Finance Agency to institutional investors from 2012-2018 through its REO-to-Rental Initiative. This program included the $1 billion loan to Invitation Homes referenced earlier in this report. While these acquisitions helped to stabilize a distressed housing market, tighter supply and higher prices are often attributed to the rise of institutional investors during this period.
In 2024, the Government Accountability Office (GAO) released a congressionally requested report on institutional investment. This synthesis of prior research is frequently cited by media outlets and policymakers, and it is an acknowledgement of the issue’s significance as a national policy concern. In the findings of multiple studies reviewed in the report, institutional investor activity after the Great Recession was correlated with higher home prices, though the impact and implications of this effect varied. Some research found that bulk purchases of foreclosed properties stabilized neighborhoods by boosting demand in distressed markets, while others emphasized that investors’ long-term removal of properties from the for-sale market tightened supply and contributed to broader price appreciation.
Some research also noted benefits in the form of expanded access to professionally managed single-family rentals, particularly for households unable to secure mortgages. As alluded to in the previous section, definitions of institutional investors varied from companies owning more than 50 homes to any explicitly corporate entity that purchased even a single property.
The GAO report also compiled research on the effect that investors have on rent prices, the decision to rent vs. home ownership, and tenant conditions. The authors note that these effects are less clear due in part to a lack of a clear definition of an institutional investor. These mixed results also point to the challenge of isolating investor activity from the broader housing market forces that shape both prices and affordability.
Taken together, these studies suggest that while the prevalence of institutional investors can correlate with short-term price movements, it generally reflects broader housing market dynamics rather than driving them. Investors tend to follow underlying conditions such as strong demand and limited supply or favorable financing, though they may amplify these trends by bidding up prices in tight markets or providing liquidity in distressed ones. The presence of institutional investors can intensify local outcomes, but the direction of housing costs is still determined by fundamental factors like population movement, construction costs, interest rates and land-use policies.
Importantly, much of the existing literature is relevant to the aftermath of the Great Recession, when investors placed a floor under collapsing home prices by purchasing distressed properties. In that context, investor activity acted as a stabilizing force, helping prices recover after bottoming out at about 40 percent of their 2001 benchmark level in 2012. The present market is the inverse. Rather than a surplus of foreclosures and falling home values, housing supply is historically tight and prices continue to climb. The share of purchases by institutional investors peaked in the earlier environment, and the same dynamic once viewed as stabilizing is now seen by many as intensifying affordability challenges. This contrast underscores the need to consider investor activity not only in terms of who is buying and how much, but also in terms of how market context changes the effect of institutional buying.
Investors and the housing shortage
It is important to view investors’ effects on the housing market in the proper context. Their share of ownership in the market varies around the country, and their impact often pales in comparison to that of other economic factors. However, there are ways in which investor ownership can both exacerbate and alleviate housing shortages.
One frequently cited concern centers on investors’ ability to buy large quantities of homes: that when institutional investors, which have greater capital to make bulk purchases, turn properties into long-term rentals, it shrinks the housing stock available for potential buyers by diverting housing that could otherwise enter the for-sale market. This is also posited as one way in which projects backed by institutional capital, such as build-to-rent (BTR) developments, can lead to increases in home prices where supply is either rising or stable.
However, BTR does not shrink the housing stock; by definition, the practice of building neighborhoods of single-family homes to rent directly adds to housing stock. Even when investors convert purchased properties into single-family rentals, they are often responding to demand from households that, for a number of lifestyle, financial or mobility reasons, prefer to rent. The desire to live in a better school district is one frequent example of this. A reallocation of units between tenure types, as opposed to a reduction of the physical stock of housing, means the net effect on supply is neutral, and the consequences of such a reallocation depends on the type of shortage in a given area.
While greater purchasing power can grant institutional investors considerable influence over the housing market, their effect on the market is not always negative. Institutional investors have been shown to alleviate housing shortages in some contexts.
A robust study published in May 2025 by New York University professor Joshua Coven detailed the effects of investor entry into the housing market where households, small landlords and construction can respond. A common misconception on the topic is that institutional investors make bulk purchases with the intention of keeping a majority of homes purchased off the market and vacant in order to drive up the rental prices of other homes in their portfolio. However, Coven’s study found that institutional investors instead tend to increase rental supply and lower rent costs overall. That is because the efficiencies from managing large portfolios outweigh the incentive to use market power to decrease the number of homes available for rent. While reducing the number of homes available for purchase raises home prices, the impact on homeownership is one-fifth of what it would be without the added rental supply, and the price impact is much lower than the observed association between investor purchases and actual price increases. This is an important distinction between correlation (investors buy homes in expensive or growing areas) and causation (investors are the main reason for price increases).
The study also found that institutional rentals attract tenants from lower-income areas with weaker schools and less economic mobility, offering them more neighborhood choices. These results suggest that institutional investors can benefit renters and current homeowners, but can make buying harder for prospective homeowners.
According to Coven, most of the link between institutional investors and housing cost increases comes from the tendency for investors to choose areas already likely to see rising prices and rents, not from their direct market influence. It further warns that using public policy mechanisms to remove such investors would actually raise rents by reducing rental supply.
Similar findings were published in February 2025 by the American Action Forum. AAF concluded that institutional investors have expanded rental supply, which drove down rents while enabling lower income families to move to previously inaccessible areas. AAF also noted that investors tended to improve the quality of existing housing and add liquidity to markets experiencing shortages.
The importance of rental supply is amplified considering how the current lending environment has affected potential homebuyers’ ability to qualify for mortgages. High interest rates and the limited creation of new housing stock have kept many people, especially first-time homebuyers and young families, from transitioning into homeownership, thereby extending their reliance on the rental market.
Institutional investors in metro Atlanta
The scale of investors’ impact depends on a number of economic and geographic factors, and one of the most intuitive is their market share of properties and units owned. As previously mentioned, metro Atlanta is consistently reported to have the largest concentration in the nation, which is a reason for the issue’s prevalence in Georgia and the South. Data compiled by the housing analytics firm John Burns Research and Consulting in July 2025 concluded that Atlanta had the largest share of single-family rental home stock owned by institutional investors (defined as owning 100 or more properties) at 27.9 percent, four times the national average.
Parcl Labs in 2023 published research about the presence of “large operators,” defined as those owning 1,000 or more units, and found that “13.3 percent of large operators’ total portfolios concentrated in [metro Atlanta’s] housing market.” This is more than double the second-closest market, 5.4 percent in Dallas, Texas. With investors’ share of metro Atlanta’s housing market this high, it is reasonable to infer that the effects of their presence may be amplified and more visible than in other areas.
Metro Atlanta’s concentration of institutional ownership helps explain why academic and political scrutiny has centered on a set of major firms that contribute to this trend. Part of Coven’s study focuses on seven major institutional investors: Invitation Homes, American Homes for Rent, Tricon Residential (now owned by Blackstone Inc.), Progress Residential, FirstKey Homes, Main Street Renewal and Home Partners of America. Four of these companies, Invitation Homes, Main Street Renewal, Progress Residential and Tricon Residential, were part of Sen. Ossoff’s investigation referenced earlier. These investors owned 0.17 percent of national housing stock in February 2021 and 5.4 percent of the stock in Paulding County at the same time. Coven notes that “the specific location choices suggest that institutional investors are more likely to have a local impact on U.S. cities, rather than a broad impact on the whole country, and that their investment strategy is highly dependent on geography.”
However, appropriate framing of available data is important if policymakers and advocates intend to address the root causes of housing problems. The negative impact of institutional investors–supposing that buying vs. renting is the zero-sum game its critics perceive it is–typically amounts to amplifying the effects of underlying supply constraints. Paulding County is a useful example of where pressure from population growth meets constraints on supply. Zoning regulations, lot size minimums and other development requirements limit the county’s capacity to build. While having one of the fastest-growing populations in Georgia, Paulding County currently experiences increased home prices, weakening home sales and a decline in the issuance of building permits. Local policies that restrict new development also unintentionally heighten market pressure, which creates conditions that attract outside investors while limiting the supply response that could offset their impact.
Institutional investors and homeownership rates
While the definition of investor-owned housing may vary (small, medium, large, institutional), one economic indicator that can provide us with guidance on the prevalence of homes being rented is owner-occupancy. The U.S. Census Bureau collects data on how many homes are occupied by their owners. Owner-occupancy provides an important control variable in examining homeownership within a community, especially over an extended period of time in comparison to those on the rental market. All else being equal, if the owner-occupancy rate in an area is holding steady, then we might conclude that institutional investors are simply buying properties that smaller investors otherwise would have owned–rather than preventing people from becoming homeowners. One oft-cited example of this is the offloading of short-term rentals by “mom and pop” investors as vacation rentals declined during the early months of the COVID-19 pandemic.
It is important to note there are also distinctions in the method in which owner-occupancy data can be displayed. Homeownership rates are frequently displayed either as a percentage of housing units occupied by their owner, or as the percentage of residents in a community who live in owner-occupied housing, i.e., two parents and three kids equates to five residents in owner-occupied housing (as a percentage of total population). For the purposes of this study, we rely on the Census methodology which relies on housing units.
In the Federal Reserve Economic Data (FRED) in the chart below, collected and published by Kevin Erdmann, senior affiliated scholar at the Mercatus Center at George Mason University, we can examine the homeownership rate in metro Atlanta. Notably, this chart also compares homeownership rates with the home price index of both the highest and lowest tiered price homes in the Atlanta MSA from 2000-present. On the left side of the chart, home prices from March 2001 (red and black lines) are used as the benchmark for the index. The right side of the chart indicates the percentage of homes which are owner-occupied (blue line).
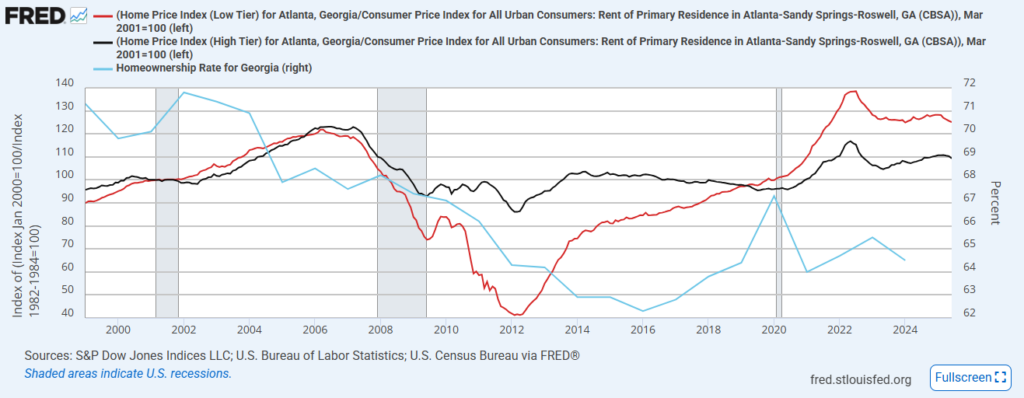
As Erdmann observes, “the large push of institutional ownership happened in the mid-2010s … that’s when homeownership rates were declining in Georgia. For much of that time, home prices were deeply below a reasonable level (especially in low-tier submarkets that were locked out of the mortgage market by federal regulators).” What Erdmann acknowledges here is that those who would typically purchase homes on the lowest price tier were suddenly limited in their access to credit, which was a result of the banking reforms in the Dodd-Frank Act. As documented in the catalog of research on this topic, this particular void was effectively filled by institutional investors. Even high-income earners with average to bad credit histories were statutorily prevented from qualifying for home mortgages.
He also points out that homeownership rates in metro Atlanta have been increasing at a steady rate of about 0.3 percent annually since the after-effects of the mortgage shock ended (the outlier seen in the 2020 homeownership rate is attributed to the Census Bureau halting data collection during the COVID-19 pandemic).
Erdmann continues by explaining that the number of “naturally forming households”–such as a child moving out of their parents’ house or a couple getting married and moving in together–“is closer to the 62 percent bottom, and the current homeownership rate in Georgia is inflated because renter households aren’t forming. It’s the lack of renter households that is lifting the homeownership rate.” He goes on to mention two specific examples for how current societal tendencies are reflected in these data: adult children continuing to live with their parents and homeowners being forced to take on roommates for financial reasons. The larger trend of potential homebuyers being locked out of the mortgage market is examined in further detail later in the study.
Lastly, Erdmann uses the chart to indicate the lack of correlation between home prices and the presence of institutional investors (reflected in the homeownership rate) in the Atlanta market. “Home prices were no higher when homeownership bottomed than they had been before it started to decline.” The lowest concentration of homeownership in the 25 years of data collected occurred from 2014-2017. This period, with the highest concentration of single-family homes in the hands of investors and renters, resulted in home prices that were roughly the same among high-tier homes, and were lower among low-tier homes, than before the Great Recession.
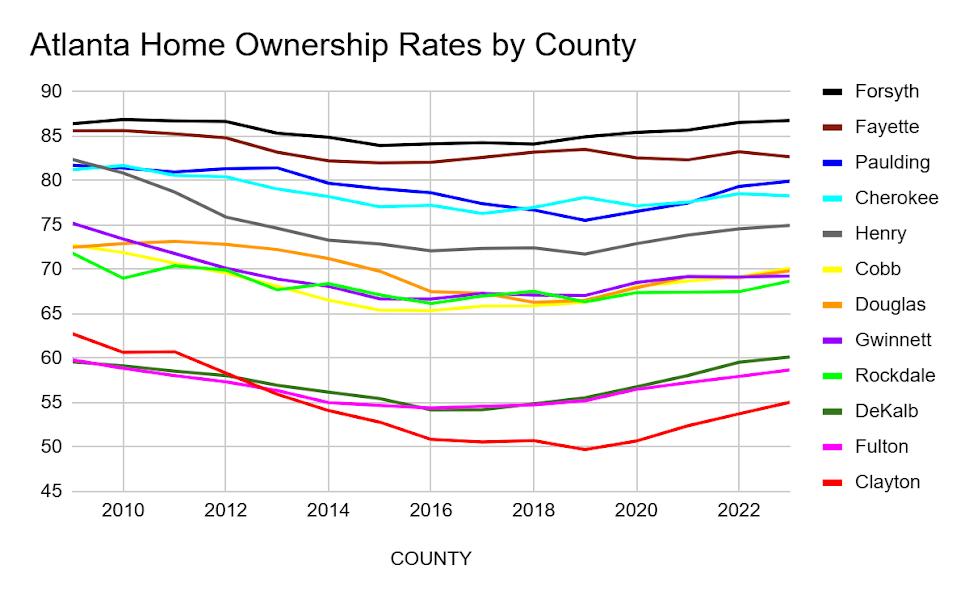
We can also examine homeownership rates at the county level to further explore whether there has been an increase in the presence of investor-owned homes. This chart, compiled by the Georgia Public Policy Foundation using data from the Federal Reserve Bank of St. Louis’ FRED database, shows homeownership rates in 12 metro Atlanta counties from 2009-2023. Homeownership rates were calculated by dividing the estimated total population in owner-occupied units by the estimated total population. Specifically, rates of homeownership over this period were the lowest in Clayton, Fulton and DeKalb Counties, while the highest homeownership rates were in Forsyth, Fayette, Cherokee and Paulding Counties.
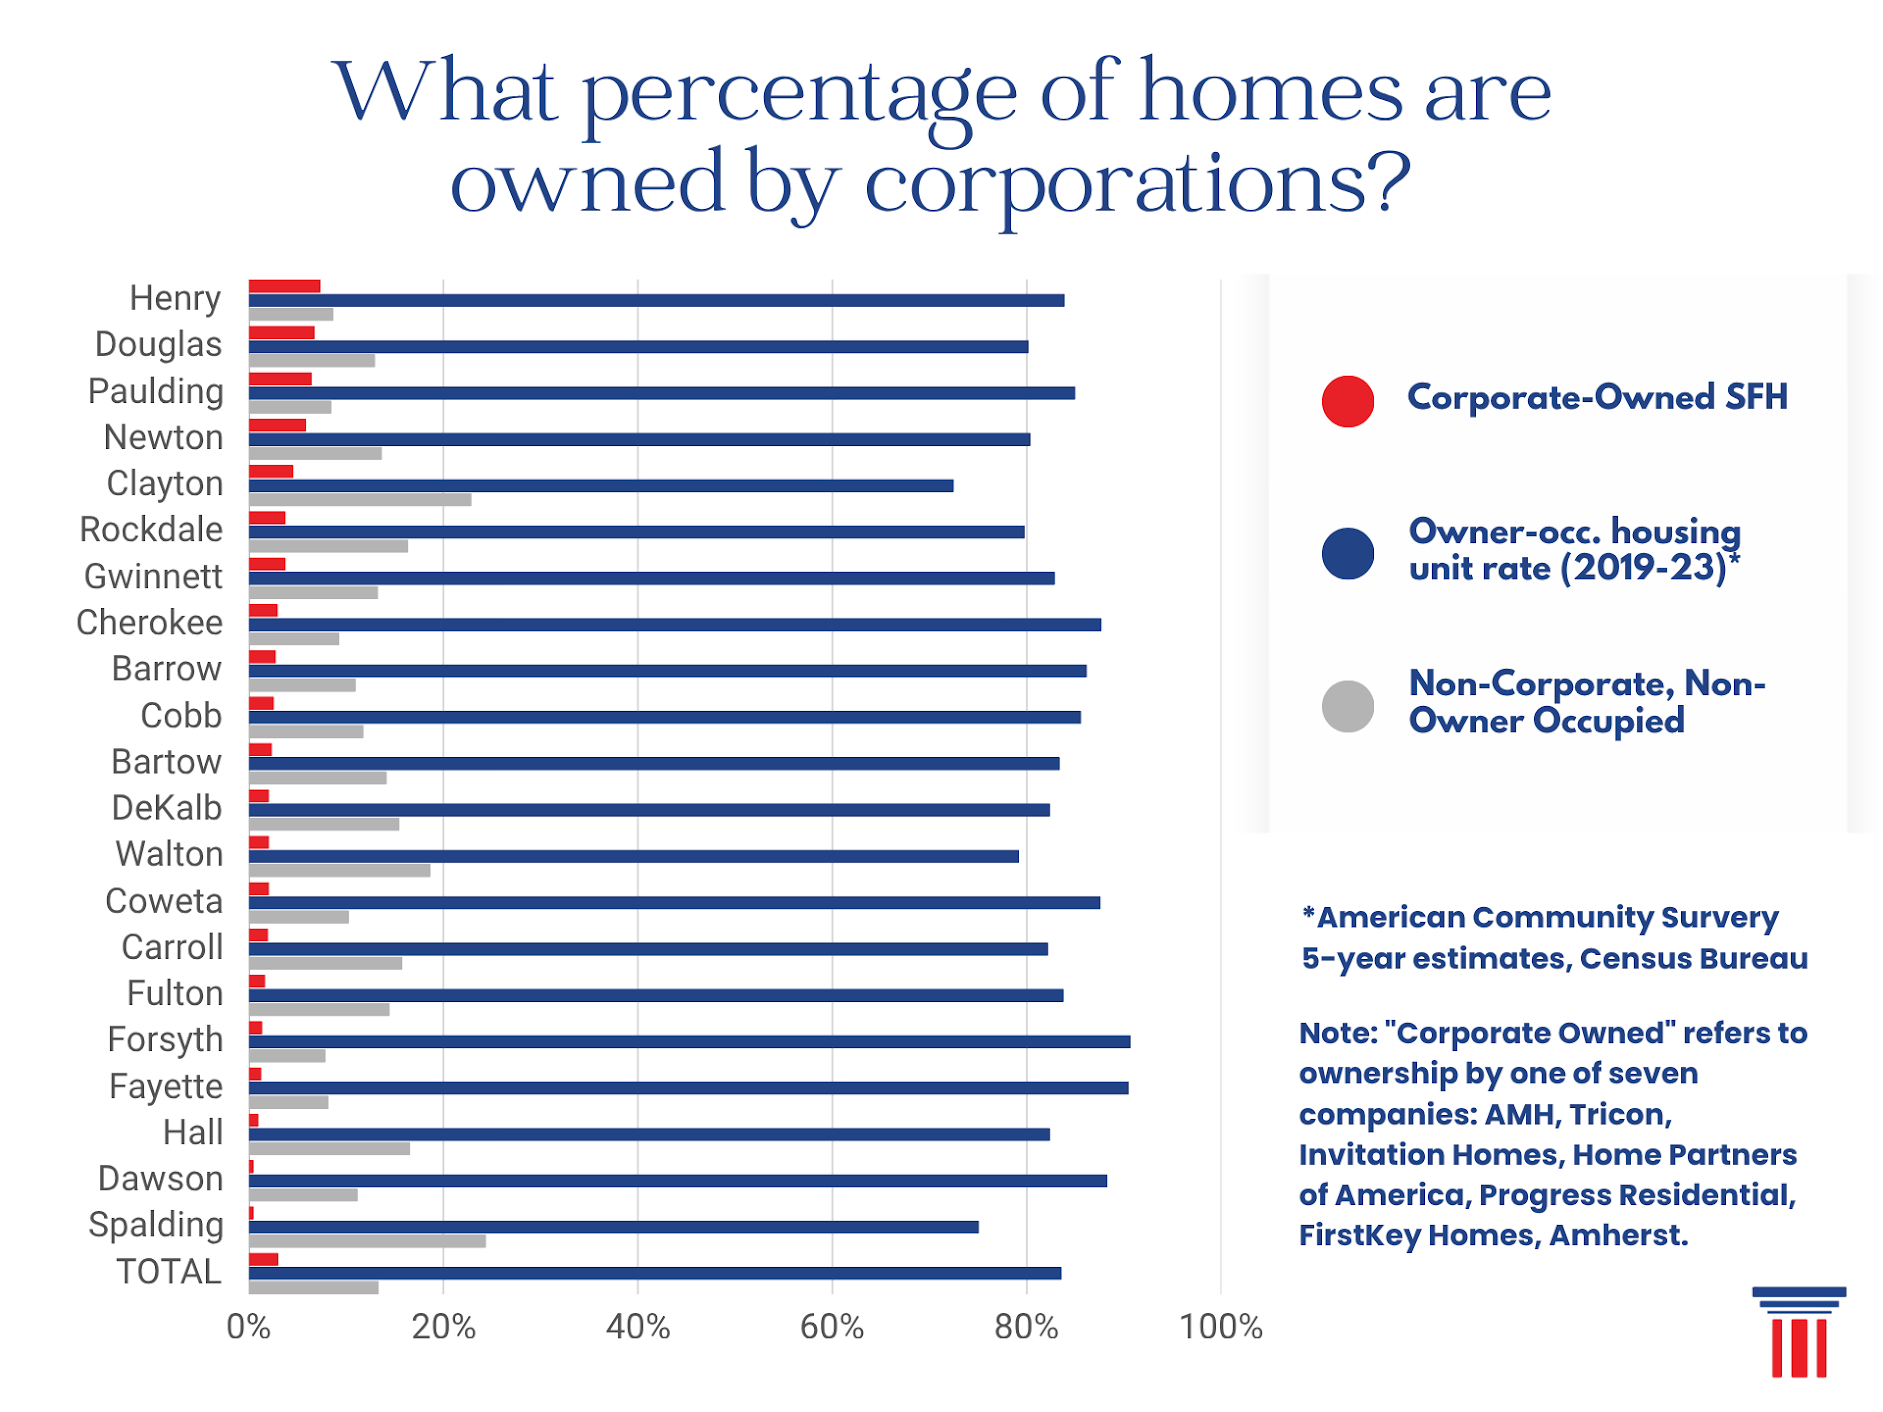
Here, we can compare the level of investor presence in each metro Atlanta county to the percentages of owner-occupied housing. The seven companies referenced in the chart that make up “Corporate-Owned SFH” were identified as “nationwide corporate landlords” in research from Parcl Labs that “uses an advanced algorithm to identify and track ‘true owners’ in the housing market (such as corporate LLCs).” Owner-occupancy in this chart is determined by dividing the number of single-family, owner-occupied housing units by the total stock of single-family housing. The counties are ordered from highest level of investor presence (8.27 percent in Henry County) to lowest (0.53 percent in Spalding County). Here, we see that even in Henry County, the share of single-family homes owned by corporate investors is lower than the share of those owned by other investors. Also of note, the owner-occupancy rate in Henry (per the earlier chart) rose steadily since 2019.
Institutional investors in context of the housing market
Housing problems throughout the nation far predate the rise of institutional investors. Georgia has reaped the benefits of adding a million new residents each decade since 1980, but housing production has not kept pace with demand. As the Foundation noted in its previous housing report, this problem was greatly exacerbated by the Great Recession, as the 2010s saw half as many homes built as in the previous decade. This “lost decade” coincided with the rise of institutional investors. Given their concentration of significant capital in the market, they have become an easy target for rising populist sentiment, earning labels like “Wall Street,” “big banks” and “large, out-of-state corporations.”
This targeting has been reinforced by frequently cited local research, such as a study from Georgia State University which asserts that three companies own roughly 19,000 single-family rental homes in the Atlanta area. This accounts for roughly 11 percent of the region’s single-family rental market. This figure is often cited as evidence that investors are shutting out potential home buyers.
However, as Erdmann points out, metro Atlanta has nearly 3 million total homes, meaning these 19,000 homes represent only 0.6 percent of the total housing market. In that context, the companies’ share is far too small to explain metro Atlanta’s broader housing affordability challenges.
The dropoff in housing production in the face of sustained population growth presents the clearest answer in an increasingly complex housing market. As Erdmann summarizes, “In the decade leading up to 2008, Georgia reliably permitted new homes equal to about 2.5 percent of the existing stock of homes. It hasn’t topped 1.5 percent since 2007. Georgia permitted 0.5 percent of its existing stock of homes in 2012, when institutional buyers were starting to enter the market. It’s taken more than a decade for large institutions to buy up a couple percentage points of Georgia homes. If this was a problem–if this really was ‘shutting homebuyers out’ of the Georgia housing market–exactly how was this not a solvable problem? Georgia couldn’t have permitted an additional, say, 0.2 percent of new homes for homeowners each year to make up for it?”
Public policy proposals to limit investor activity could result in some short-term impacts, such as easing competition for starter homes and expanding opportunities for individual buyers, but it could also risk unintended consequences like reducing the rental supply. Regardless, such action would address a symptom rather than a cause of enduring housing trends. Evidence suggests that much of the link between investors and rising prices reflects investors’ targeting of markets with population growth but not growth of housing stock, rather than directly causing price increases. In other words, the same policy problems that attracted investors to metro Atlanta in the first place are preventing the supply side of the market from correcting any price pressure they might be creating.
It is therefore possible that limiting their market presence might do little to lower prices while further shrinking the supply of housing options. Impact overall would depend on whether such policies are joined by broader supply-side reforms in zoning, construction and affordability, which remain far more fundamental constraints on access and costs.
In a recent op-ed, Reason Foundation vice president Adrian Moore and Reason policy analyst Eliza Terziev argued that public policy targeting of institutional investors stems from a misunderstanding of both how they operate and the real scale of their presence in the housing market. They note, “the market is not acting as the critics of institutional investors say. If investors are driving up prices, the natural market response would be to increase supply … but while prices did increase, housing supply hasn’t kept up. Persistent regulatory barriers, including zoning restrictions, minimum lot sizes, limits on multifamily housing, and long and costly permitting processes have made it difficult, if not impossible, to meet the rise in demand in a cost-effective way.”
Mortgage regulations and the ability to purchase a home
As noted earlier, people choose to rent for various reasons. What is less discussed is the number of potential home buyers who are forced to rent. Because most credit agencies and the Consumer Financial Protection Bureau (CPFB) define credit scores and their associated numeric ranges differently, a number is provided when discussed below to help define the criteria.
The data reflect an increasing shortage of mortgages available for those who do not have “superprime” credit scores of 760+ points. Primarily this is because these potential buyers are no longer eligible to qualify for a mortgage due to lending regulations enacted after the Great Recession. Notably, this includes potential buyers with “good” and “very good” credit scores, and not just the subprime mortgage market, 0 percent adjustable rate mortgages and the NINJA (no income, no job, no assets) loans typified with the housing market bubble of the Great Recession.
The prevalence of these subprime home mortgages and the resulting widespread loan defaults led policymakers to create tougher lending requirements for home mortgages through the Dodd-Frank Act. As the CPFB wrote in its summary of the qualified mortgage standards that were enacted, “During the years preceding the mortgage crisis, too many mortgages were made to consumers without regard to the consumer’s ability to repay the loans. Loose underwriting practices by some creditors—including failure to verify the consumer’s income or debts and qualifying consumers for mortgages based on “teaser” interest rates that would cause monthly payments to jump to unaffordable levels after the first few years—contributed to a mortgage crisis that led to the nation’s most serious recession since the Great Depression.”
To safeguard against “loose underwriting practices,” eight minimum criteria were implemented for creditors. These included items such as expected income or assets, employment status, monthly mortgage payment debt obligations and credit history. The practical effect has been to increasingly keep those without “superprime” mortgage scores from qualifying to purchase a home, as the chart below demonstrates.
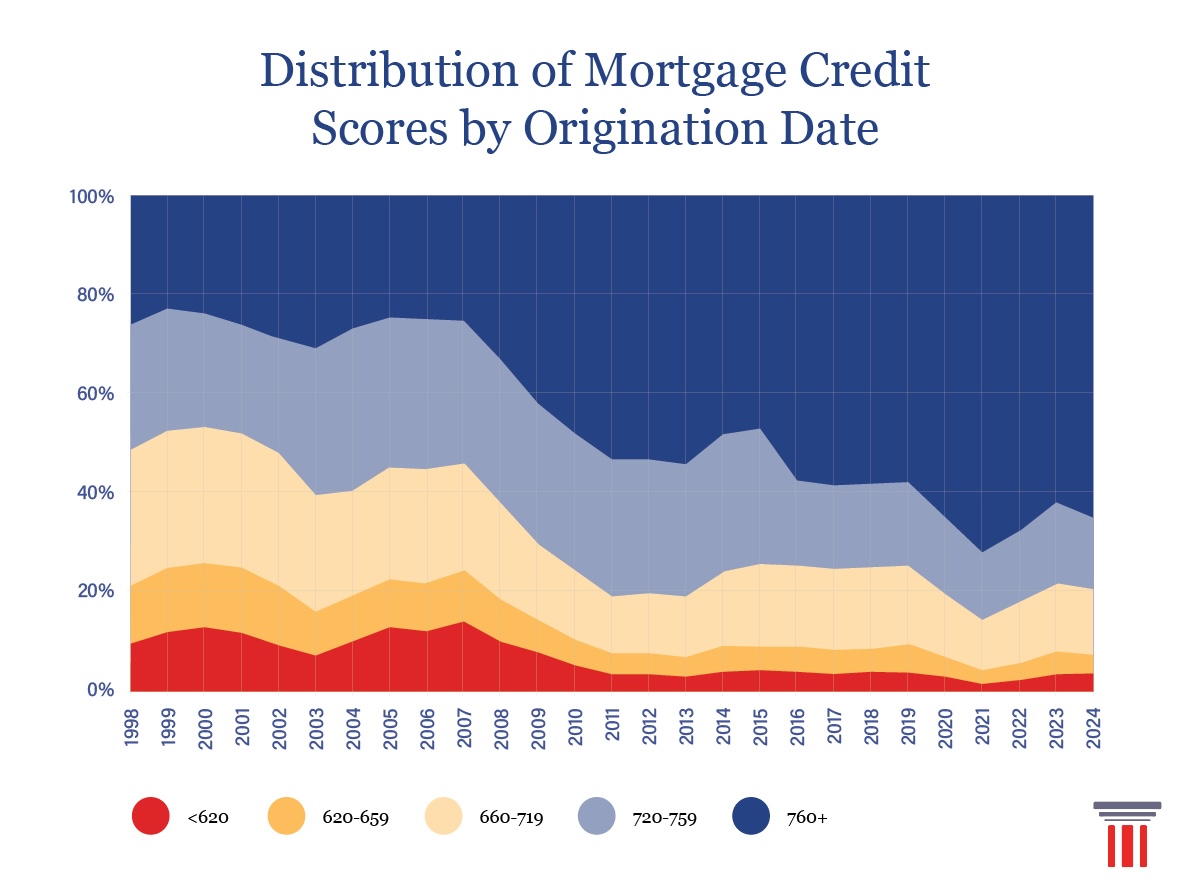
In this dataset, collected by the Federal Reserve Bank of New York, we see that in 2005 home mortgage recipients with “superprime” credit scores, defined here as 760 or higher, constituted roughly 25 percent of home mortgages. Twenty years later, borrowers in this same credit tier comprise almost 65 percent of home mortgages originated. While policymakers may debate the correct credit score for being eligible to receive a home mortgage, it appears likely that as long as the current lending regulations remain in place, investor-owned housing will remain the primary bridge option for those unable to purchase a home.
Conclusion
Housing shortages in Georgia and throughout the country affect several aspects of public policy and daily life. The goal of building equity through home ownership is shared by millions of citizens and is an indispensable part of the American dream. Building a durable supply of affordable housing is an effort that needs attention from stakeholders across the spectrum of politics and government.
The recent tendency among policymakers and policy advocates to focus on institutional investors is understandable. Their prevalence in the housing market after the Great Recession was correlated with the drop-offs in housing production and worsening housing shortages. Their presence is, at least in certain areas, associated with higher housing costs, and areas that contain high concentrations of investor-owned properties can experience constraint in the for-sale market. Their concentration of considerable capital and status as large, out-of-state financial entities makes them an easy target for criticism.
However, serious attempts to address housing unaffordability must look to more direct and fundamental causes. Furthermore, the expenditure of finite political capital in the hopes of addressing housing at large would potentially be wasted on a push to limit institutional investors. As with any policy area, the appetite for housing reform is limited and lawmakers might be less likely to focus on other more impactful solutions.
The limits of making investors central to housing policy also partly stem from a body of research that has yielded limited, mixed and inconclusive results. One of the reasons for inconsistent results is the lack of a consensus definition of institutional investors. In its report, the GAO noted that the way investors were defined was not constant across the studies it referenced, and that investor effects on factors like homeownership opportunities and tenants was unclear due to limited data and the lack of a consistent definition.
It is common to designate investors by the number of properties or units owned, but it is worth considering that this quantitative definition is too blunt to accurately describe an institutional investor. A better definition might combine a quantitative threshold with other characteristics like financialization and a portfolio-driven market strategy in order to designate owners by how they operate, not just how much they own.
Ultimately, any attempt to legislate or otherwise regulate investor activity must account for the context of how investors operate in the market. While it is true that metro Atlanta’s share of institutional investor-owned properties is the highest in the country, which could lead to more pronounced effects than would be seen elsewhere, investors still typically occupy much smaller shares of housing than other kinds of ownership. Investors might benefit from, and in some cases contribute to, existing housing trends, but they neither cause nor primarily drive them.
A more direct approach to housing policy should focus on fundamental supply-side factors that add to the cost of regulation. Hurdles like zoning ordinances, building regulations, the cost of construction materials and manpower, permitting processes and mortgage rates add to the cost of housing everywhere, and policymakers should take care not to miss the forest for the trees when trying to create a cheaper, more accessible and more diverse housing market.
Recent Commentary
Atlanta’s Infrastructure in the Global Spotlight
The Hidden Price of Social Security
The Reporting Gap in School Choice