By Kelly McCutchen
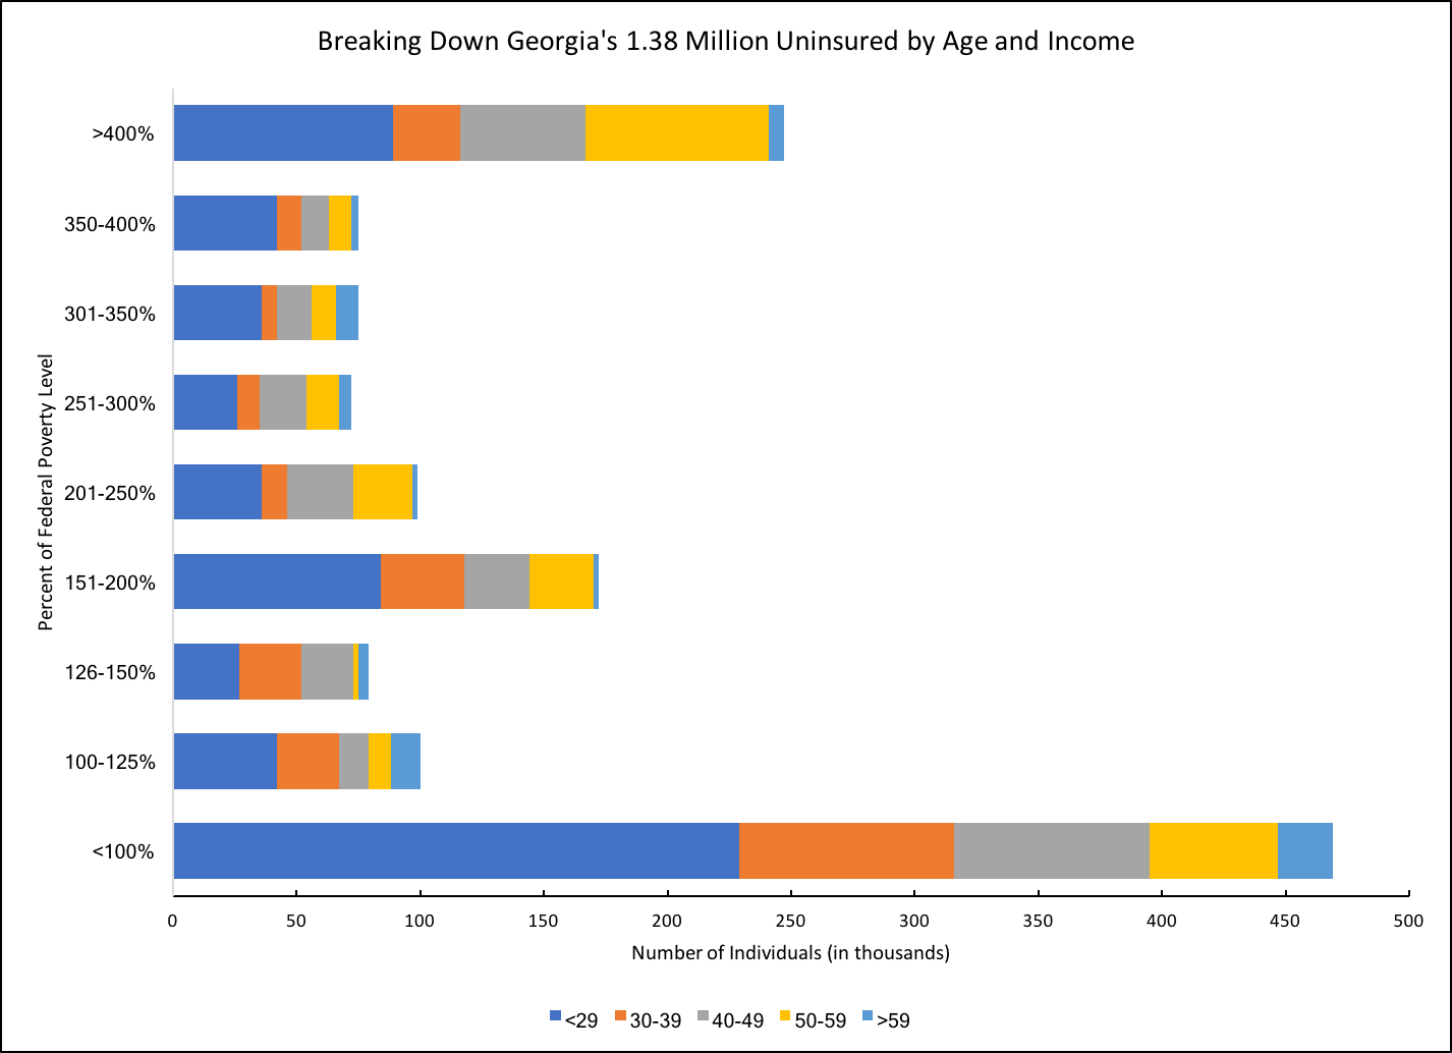
The chart below breaks down Georgia’s 1.38 million uninsured residents based on Census Bureau data for 2016.
The vertical axis represents income as a percent of the federal poverty level, which is about $12,000 for a single person. The largest group, 469,000 people represented by the bar at the bottom, is 100 percent of the federal poverty level and below. That’s 34 percent of the total uninsured individuals. If you include everyone from 200 percent of the poverty level and below, that represents 59 percent of the total.
The colors represent age. The dark blue group on the far left represents those under 29, which is 44 percent of the total. Sixty-one percent are under 40.
This highlights two of the problems with the Affordable Care Act (ACA).
First problem: Not enough young people have signed up for health insurance despite the individual mandate and tax penalties. A healthy risk pool has twice as many young people as old people. Currently the ratio is about one-to-one, which is one reason why premiums have doubled over the last four years.
Second problem: No subsidies for the poorest. The ACA’s premium tax credits are only available for people with incomes between 100 and 400 percent of the federal poverty level. The hope was that those below that level would be covered by Medicaid, but when the Supreme Court ruled states didn’t have to expand Medicaid, these individuals were left without financial assistance in states like Georgia that chose not to expand Medicaid.
Regardless of whether we end up with a Republican replacement bill or modification of the ACA, the success of the solution will depend on how these two challenges are addressed.

By Kelly McCutchen
The chart below breaks down Georgia’s 1.38 million uninsured residents based on Census Bureau data for 2016.
The vertical axis represents income as a percent of the federal poverty level, which is about $12,000 for a single person. The largest group, 469,000 people represented by the bar at the bottom, is 100 percent of the federal poverty level and below. That’s 34 percent of the total uninsured individuals. If you include everyone from 200 percent of the poverty level and below, that represents 59 percent of the total.
The colors represent age. The dark blue group on the far left represents those under 29, which is 44 percent of the total. Sixty-one percent are under 40.
This highlights two of the problems with the Affordable Care Act (ACA).
First problem: Not enough young people have signed up for health insurance despite the individual mandate and tax penalties. A healthy risk pool has twice as many young people as old people. Currently the ratio is about one-to-one, which is one reason why premiums have doubled over the last four years.
Second problem: No subsidies for the poorest. The ACA’s premium tax credits are only available for people with incomes between 100 and 400 percent of the federal poverty level. The hope was that those below that level would be covered by Medicaid, but when the Supreme Court ruled states didn’t have to expand Medicaid, these individuals were left without financial assistance in states like Georgia that chose not to expand Medicaid.
Regardless of whether we end up with a Republican replacement bill or modification of the ACA, the success of the solution will depend on how these two challenges are addressed.