Anybody paying attention to 2017’s hurricanes and, even more recently, the Paris Agreement, is aware that political posturing amplifies how complicated and controversial is the science of climate change and, with it, sea level rise.
By Harold Brown

Anybody paying attention to 2017’s hurricanes and, even more recently, the Paris Agreement, is aware that political posturing amplifies how complicated and controversial is the science of climate change and, with it, sea level rise.
Environmentalist activists see sea level rise as a catastrophe in the making – the simple result of melting glaciers and ice caps and warming of the oceans. But the complications mire this in controversy ever since global warming became popular. According to the International Panel on Climate Change, the global sea level rose at the “very likely” rate of 1.7 millimeters per year from 1901-2010.
Therein lies one of the complexities. Imagine the difficulty in accurately measuring the increase when the sea rises and falls several feet every day on most coasts (about 50 feet or 15,240 millimeters in Canada’s Bay of Fundy).
Over a period of 365 days the worldwide rise is only about the thickness of a dime (1.35 mm).
- Dry land may appear solid and immovable but is fluid in geological terms. While the sea level is rising, the coast may be rising faster, which makes the ocean appear to be falling. Skagway in Alaska has a sea level rise of -17.1 mm a year, almost 13 dimes.
- Coastal land may be sinking (subsidence); making the ocean appear to be rising faster than it really is. At Grand Isle, La., the sea level rises 9.2 mm a year, about seven dimes. In the Chesapeake Bay area, half of the apparent sea level rise is actually subsidence of the coastal land.
These anomalies may occur in close proximity in time and space, confusing trends. The annual sea level rise at Oregon Inlet, NC, is only 2.82 mm, less than half as fast as at the Chesapeake Bay Bridge (6.05 mm), just about 100 miles away.
Apart from the vertical movement of coasts themselves, waves erode beaches and dunes or builds them up. Barrier islands, like those on the East Coast, grow and shrink over time.

A new island appeared in early 2017 at the tip of Cape Point near Buxton, NC. By August, it was 27 acres in size and about one mile long (see photo). The media and public called it Shelly Island, but a Cape Hatteras National Seashore press release referred to it as a no-name sandbar. It was a temporary island. The Virginian-Pilot reported in September that the island had become connected to Cape Point by a land bridge, making it part of Hatteras Island.
Whether this sandbar is temporary or permanent, it demonstrates the mobility of water and earth that occurs on many coasts worldwide. Concern is often expressed for the small atoll islands in the Pacific Ocean, for example. The poster island nation is Tuvalu. An island group with a total area one-tenth the size of Washington D.C., and population of about 11,000, it joined the United Nations in 2000 and almost immediately threatened to sue the United States and Australia for not signing the Kyoto Treaty and thus being responsible for sea level rise. The suit was, however, never brought.
As in other areas, the publicity about Tuvalu was overblown. A 2010 report in the journal Global and Planetary Change described changes in 27 atoll islands in the central Pacific (including 18 in Tuvalu) over a 19-61-year period. Results showed that 43 percent of the islands increased in area and the same percentage remained unchanged.
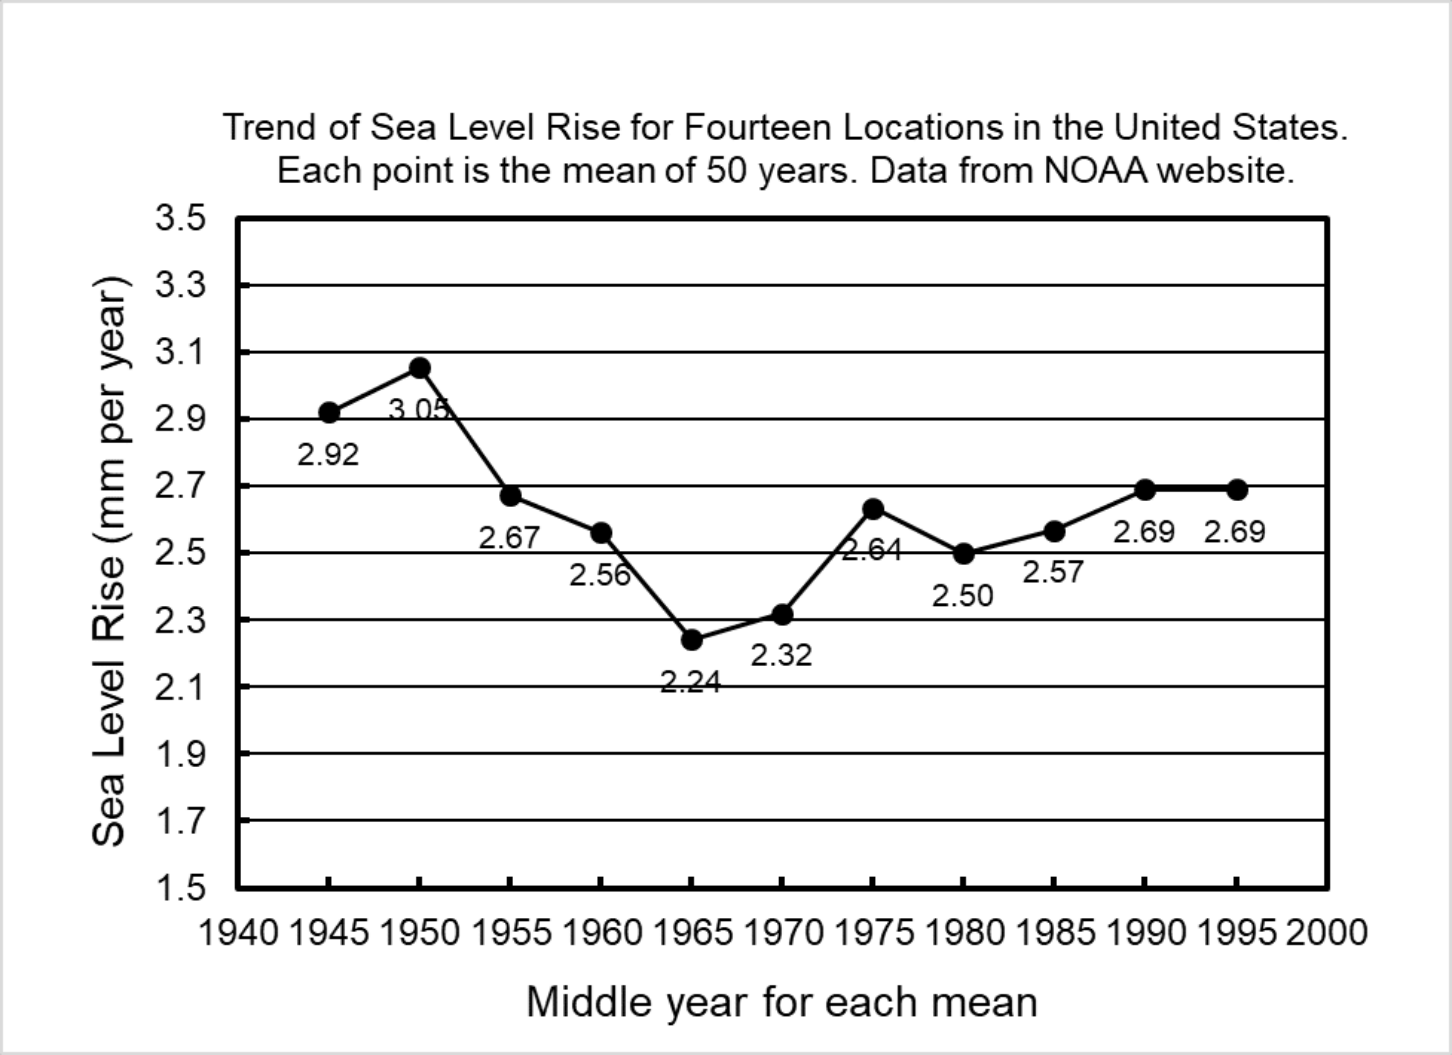
The variability associated with the small rate of sea level rise requires long periods of measurement to establish trends. NOAA publishes 50-year means on its website to show trends. Averaging data for the 14 U.S. stations with measurements extending back at least to 1920 makes it clear that U.S. sea level increases are not greater in the most recent 50 years than in mid-century (see chart).
The IPCC admitted as much in 2001, reporting, “No significant acceleration in the rate of sea level rise during the 20th century has been detected.” And again in 2013, they concluded that “Between 1993 and 2010, the rate was very likely higher (than 1.7 mm/yr., mentioned earlier) at 3.2 [2.8 to 3.6] mm yr–1; similarly high rates likely occurred between 1920 and 1950.”
But the great fear is the increase in rate. The IPCC put it clearly in 2013, “The rate of [global mean sea level] rise has likely increased since the early 1900s, with estimates ranging from 0.000 to 0.013 mm yr–1.” (Error ranges for these high and low estimates omitted.)
Accepting the annual average of the high and low estimates – 0.0065 mm – it would take 208 years for the extra rise to be a dime’s worth!
University of Georgia Professor Emeritus Harold Brown is a Senior Fellow with the Georgia Public Policy Foundation and author of “The Greening of Georgia: The Improvement of the Environment in the Twentieth Century.” The Georgia Public Policy Foundation is an independent, nonprofit think tank that proposes market-oriented approaches to public policy to improve the lives of Georgians. Nothing written here is to be construed as necessarily reflecting the views of the Georgia Public Policy Foundation or as an attempt to aid or hinder the passage of any bill before the U.S. Congress or the Georgia Legislature.
© Georgia Public Policy Foundation (November 10, 2017). Permission to reprint in whole or in part is hereby granted, provided the author and his affiliations are cited.
By Harold Brown
Harold Brown, Senior Fellow, Georgia Public Policy Foundation
Anybody paying attention to 2017’s hurricanes and, even more recently, the Paris Agreement, is aware that political posturing amplifies how complicated and controversial is the science of climate change and, with it, sea level rise.
Environmentalist activists see sea level rise as a catastrophe in the making – the simple result of melting glaciers and ice caps and warming of the oceans. But the complications mire this in controversy ever since global warming became popular. According to the International Panel on Climate Change, the global sea level rose at the “very likely” rate of 1.7 millimeters per year from 1901-2010.
Therein lies one of the complexities. Imagine the difficulty in accurately measuring the increase when the sea rises and falls several feet every day on most coasts (about 50 feet or 15,240 millimeters in Canada’s Bay of Fundy).
Over a period of 365 days the worldwide rise is only about the thickness of a dime (1.35 mm).
- Dry land may appear solid and immovable but is fluid in geological terms. While the sea level is rising, the coast may be rising faster, which makes the ocean appear to be falling. Skagway in Alaska has a sea level rise of -17.1 mm a year, almost 13 dimes.
- Coastal land may be sinking (subsidence); making the ocean appear to be rising faster than it really is. At Grand Isle, La., the sea level rises 9.2 mm a year, about seven dimes. In the Chesapeake Bay area, half of the apparent sea level rise is actually subsidence of the coastal land.
These anomalies may occur in close proximity in time and space, confusing trends. The annual sea level rise at Oregon Inlet, NC, is only 2.82 mm, less than half as fast as at the Chesapeake Bay Bridge (6.05 mm), just about 100 miles away.
Apart from the vertical movement of coasts themselves, waves erode beaches and dunes or builds them up. Barrier islands, like those on the East Coast, grow and shrink over time.
Satellite Photographs of Shelly Island at the tip of Cape Point at Buxton, NC. From the National Aeronautics and Space Administration.
A new island appeared in early 2017 at the tip of Cape Point near Buxton, NC. By August, it was 27 acres in size and about one mile long (see photo). The media and public called it Shelly Island, but a Cape Hatteras National Seashore press release referred to it as a no-name sandbar. It was a temporary island. The Virginian-Pilot reported in September that the island had become connected to Cape Point by a land bridge, making it part of Hatteras Island.
Whether this sandbar is temporary or permanent, it demonstrates the mobility of water and earth that occurs on many coasts worldwide. Concern is often expressed for the small atoll islands in the Pacific Ocean, for example. The poster island nation is Tuvalu. An island group with a total area one-tenth the size of Washington D.C., and population of about 11,000, it joined the United Nations in 2000 and almost immediately threatened to sue the United States and Australia for not signing the Kyoto Treaty and thus being responsible for sea level rise. The suit was, however, never brought.
As in other areas, the publicity about Tuvalu was overblown. A 2010 report in the journal Global and Planetary Change described changes in 27 atoll islands in the central Pacific (including 18 in Tuvalu) over a 19-61-year period. Results showed that 43 percent of the islands increased in area and the same percentage remained unchanged.
The variability associated with the small rate of sea level rise requires long periods of measurement to establish trends. NOAA publishes 50-year means on its website to show trends. Averaging data for the 14 U.S. stations with measurements extending back at least to 1920 makes it clear that U.S. sea level increases are not greater in the most recent 50 years than in mid-century (see chart).
The IPCC admitted as much in 2001, reporting, “No significant acceleration in the rate of sea level rise during the 20th century has been detected.” And again in 2013, they concluded that “Between 1993 and 2010, the rate was very likely higher (than 1.7 mm/yr., mentioned earlier) at 3.2 [2.8 to 3.6] mm yr–1; similarly high rates likely occurred between 1920 and 1950.”
But the great fear is the increase in rate. The IPCC put it clearly in 2013, “The rate of [global mean sea level] rise has likely increased since the early 1900s, with estimates ranging from 0.000 to 0.013 mm yr–1.” (Error ranges for these high and low estimates omitted.)
Accepting the annual average of the high and low estimates – 0.0065 mm – it would take 208 years for the extra rise to be a dime’s worth!
University of Georgia Professor Emeritus Harold Brown is a Senior Fellow with the Georgia Public Policy Foundation and author of “The Greening of Georgia: The Improvement of the Environment in the Twentieth Century.” The Georgia Public Policy Foundation is an independent, nonprofit think tank that proposes market-oriented approaches to public policy to improve the lives of Georgians. Nothing written here is to be construed as necessarily reflecting the views of the Georgia Public Policy Foundation or as an attempt to aid or hinder the passage of any bill before the U.S. Congress or the Georgia Legislature.
© Georgia Public Policy Foundation (November 10, 2017). Permission to reprint in whole or in part is hereby granted, provided the author and his affiliations are cited.